Product · Observability
See every request. Know every cost.
Real-time analytics for your entire LLM stack.
LLM Gateway records every request that flows through it — usage, spend, latency, errors, and cache performance — and turns it into dashboards your whole team can act on. No agents to install, no separate tracing SDK.
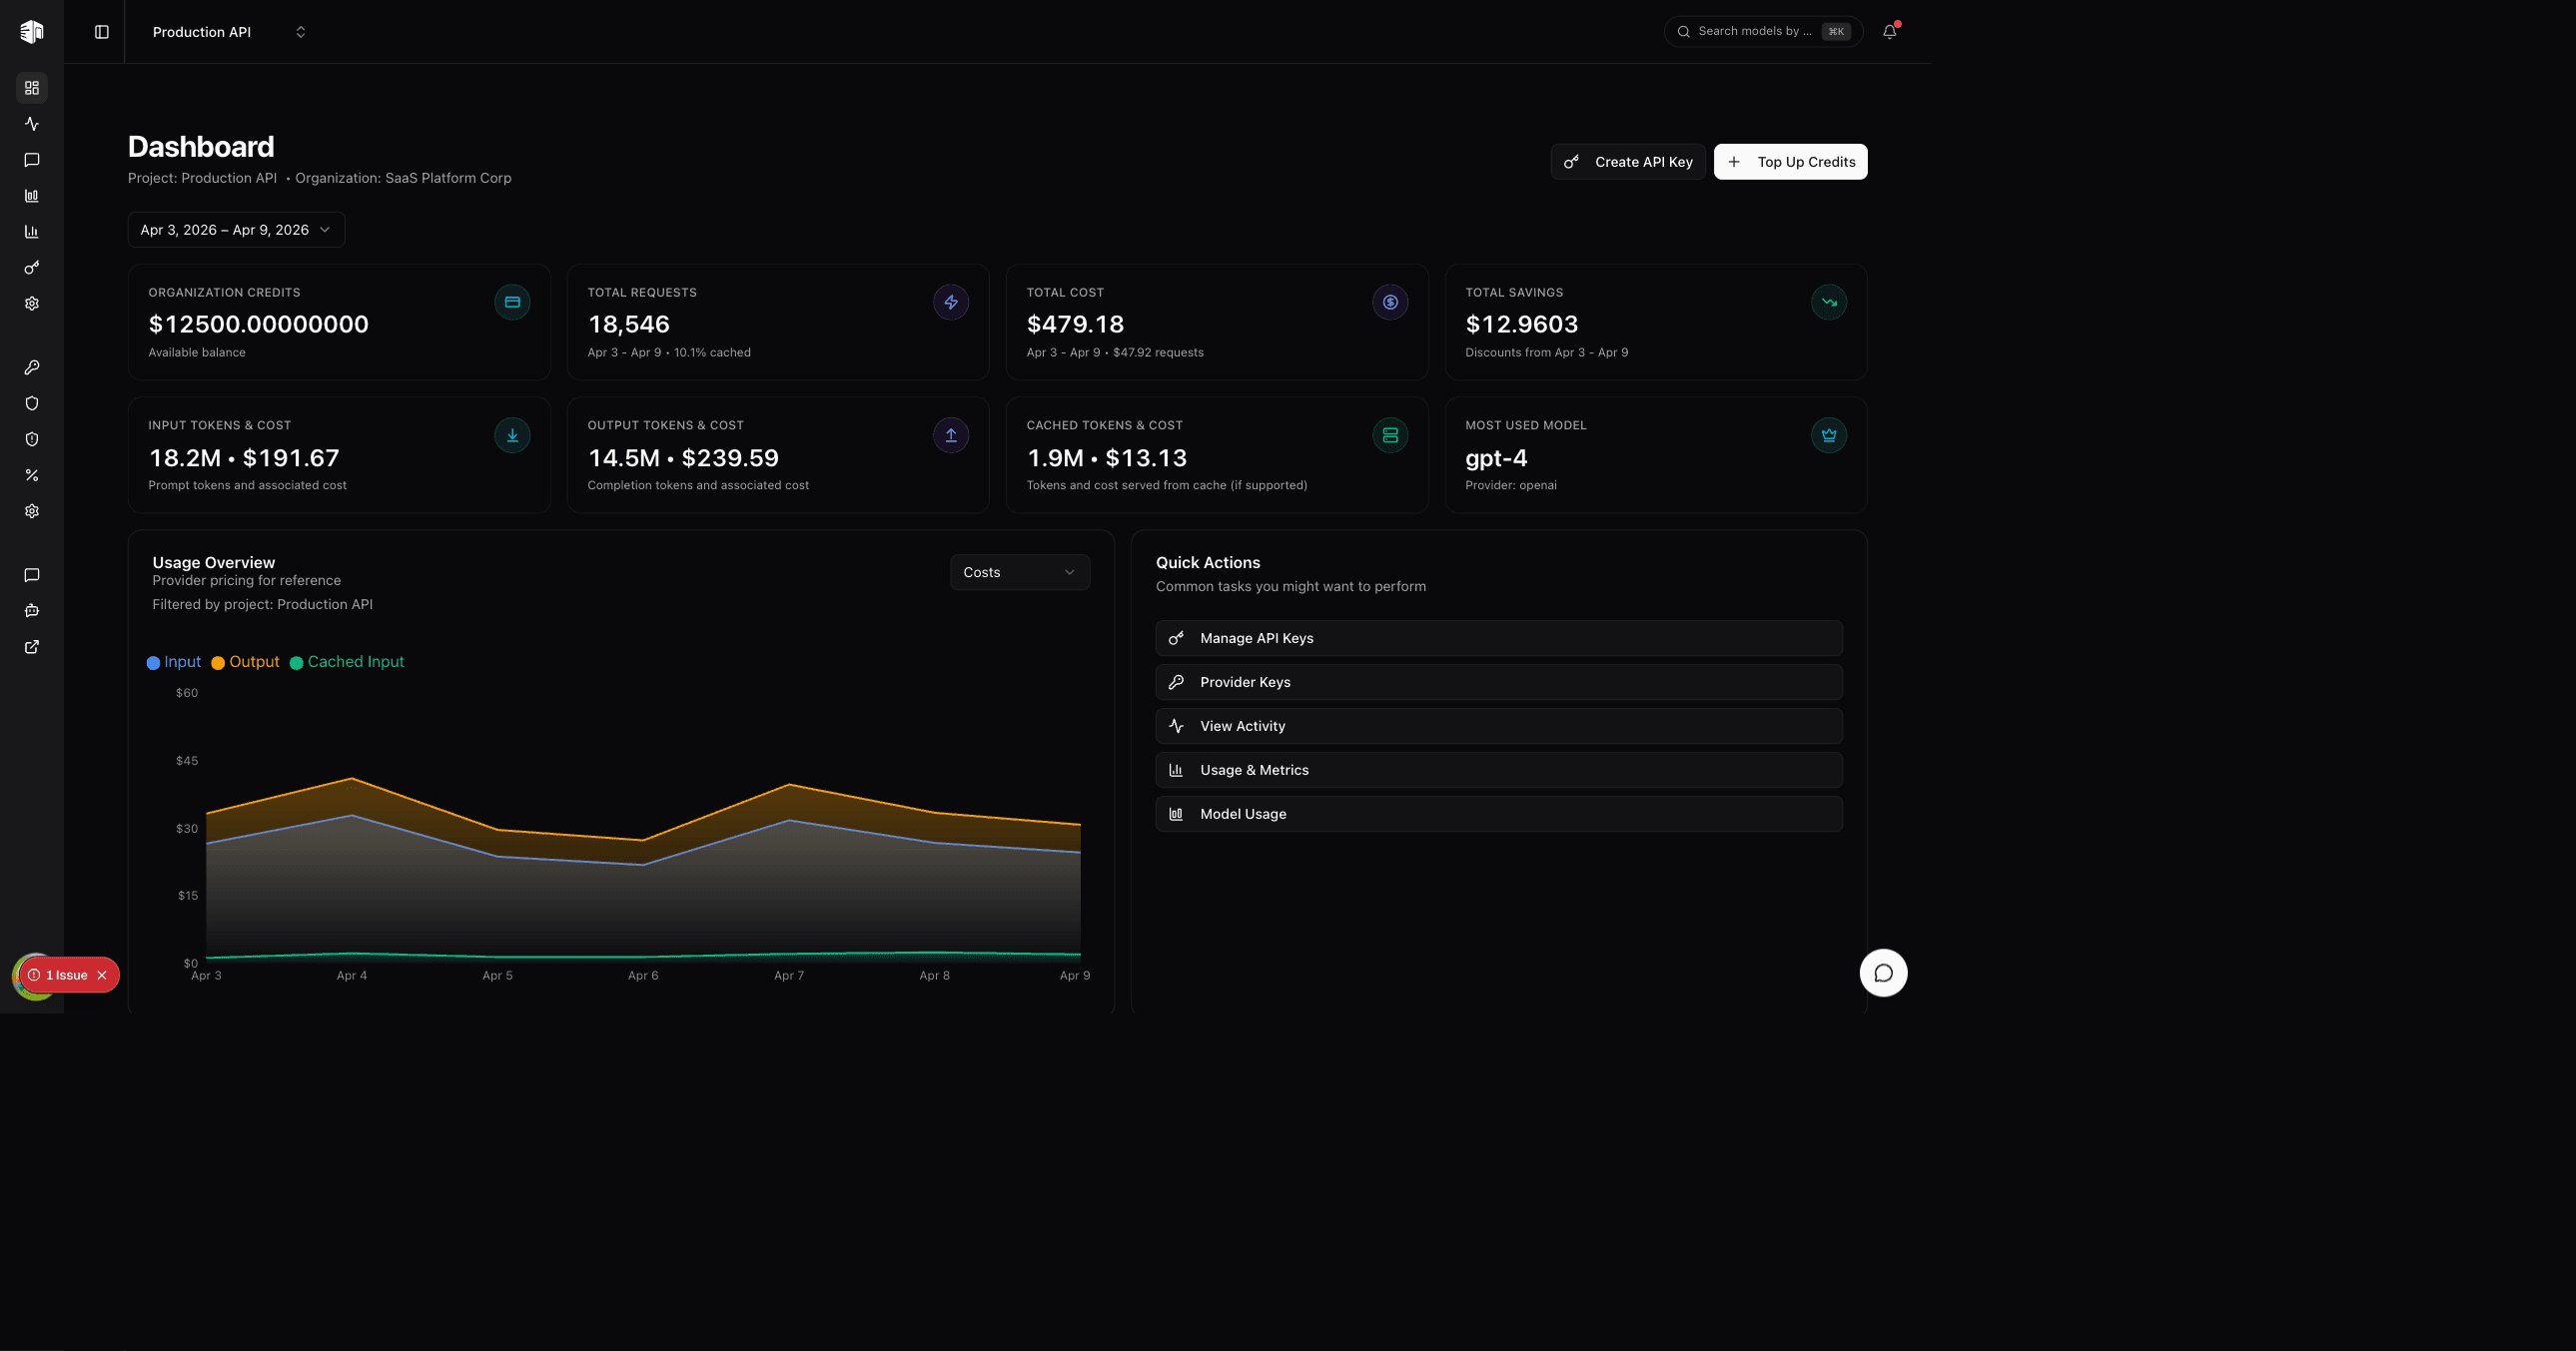
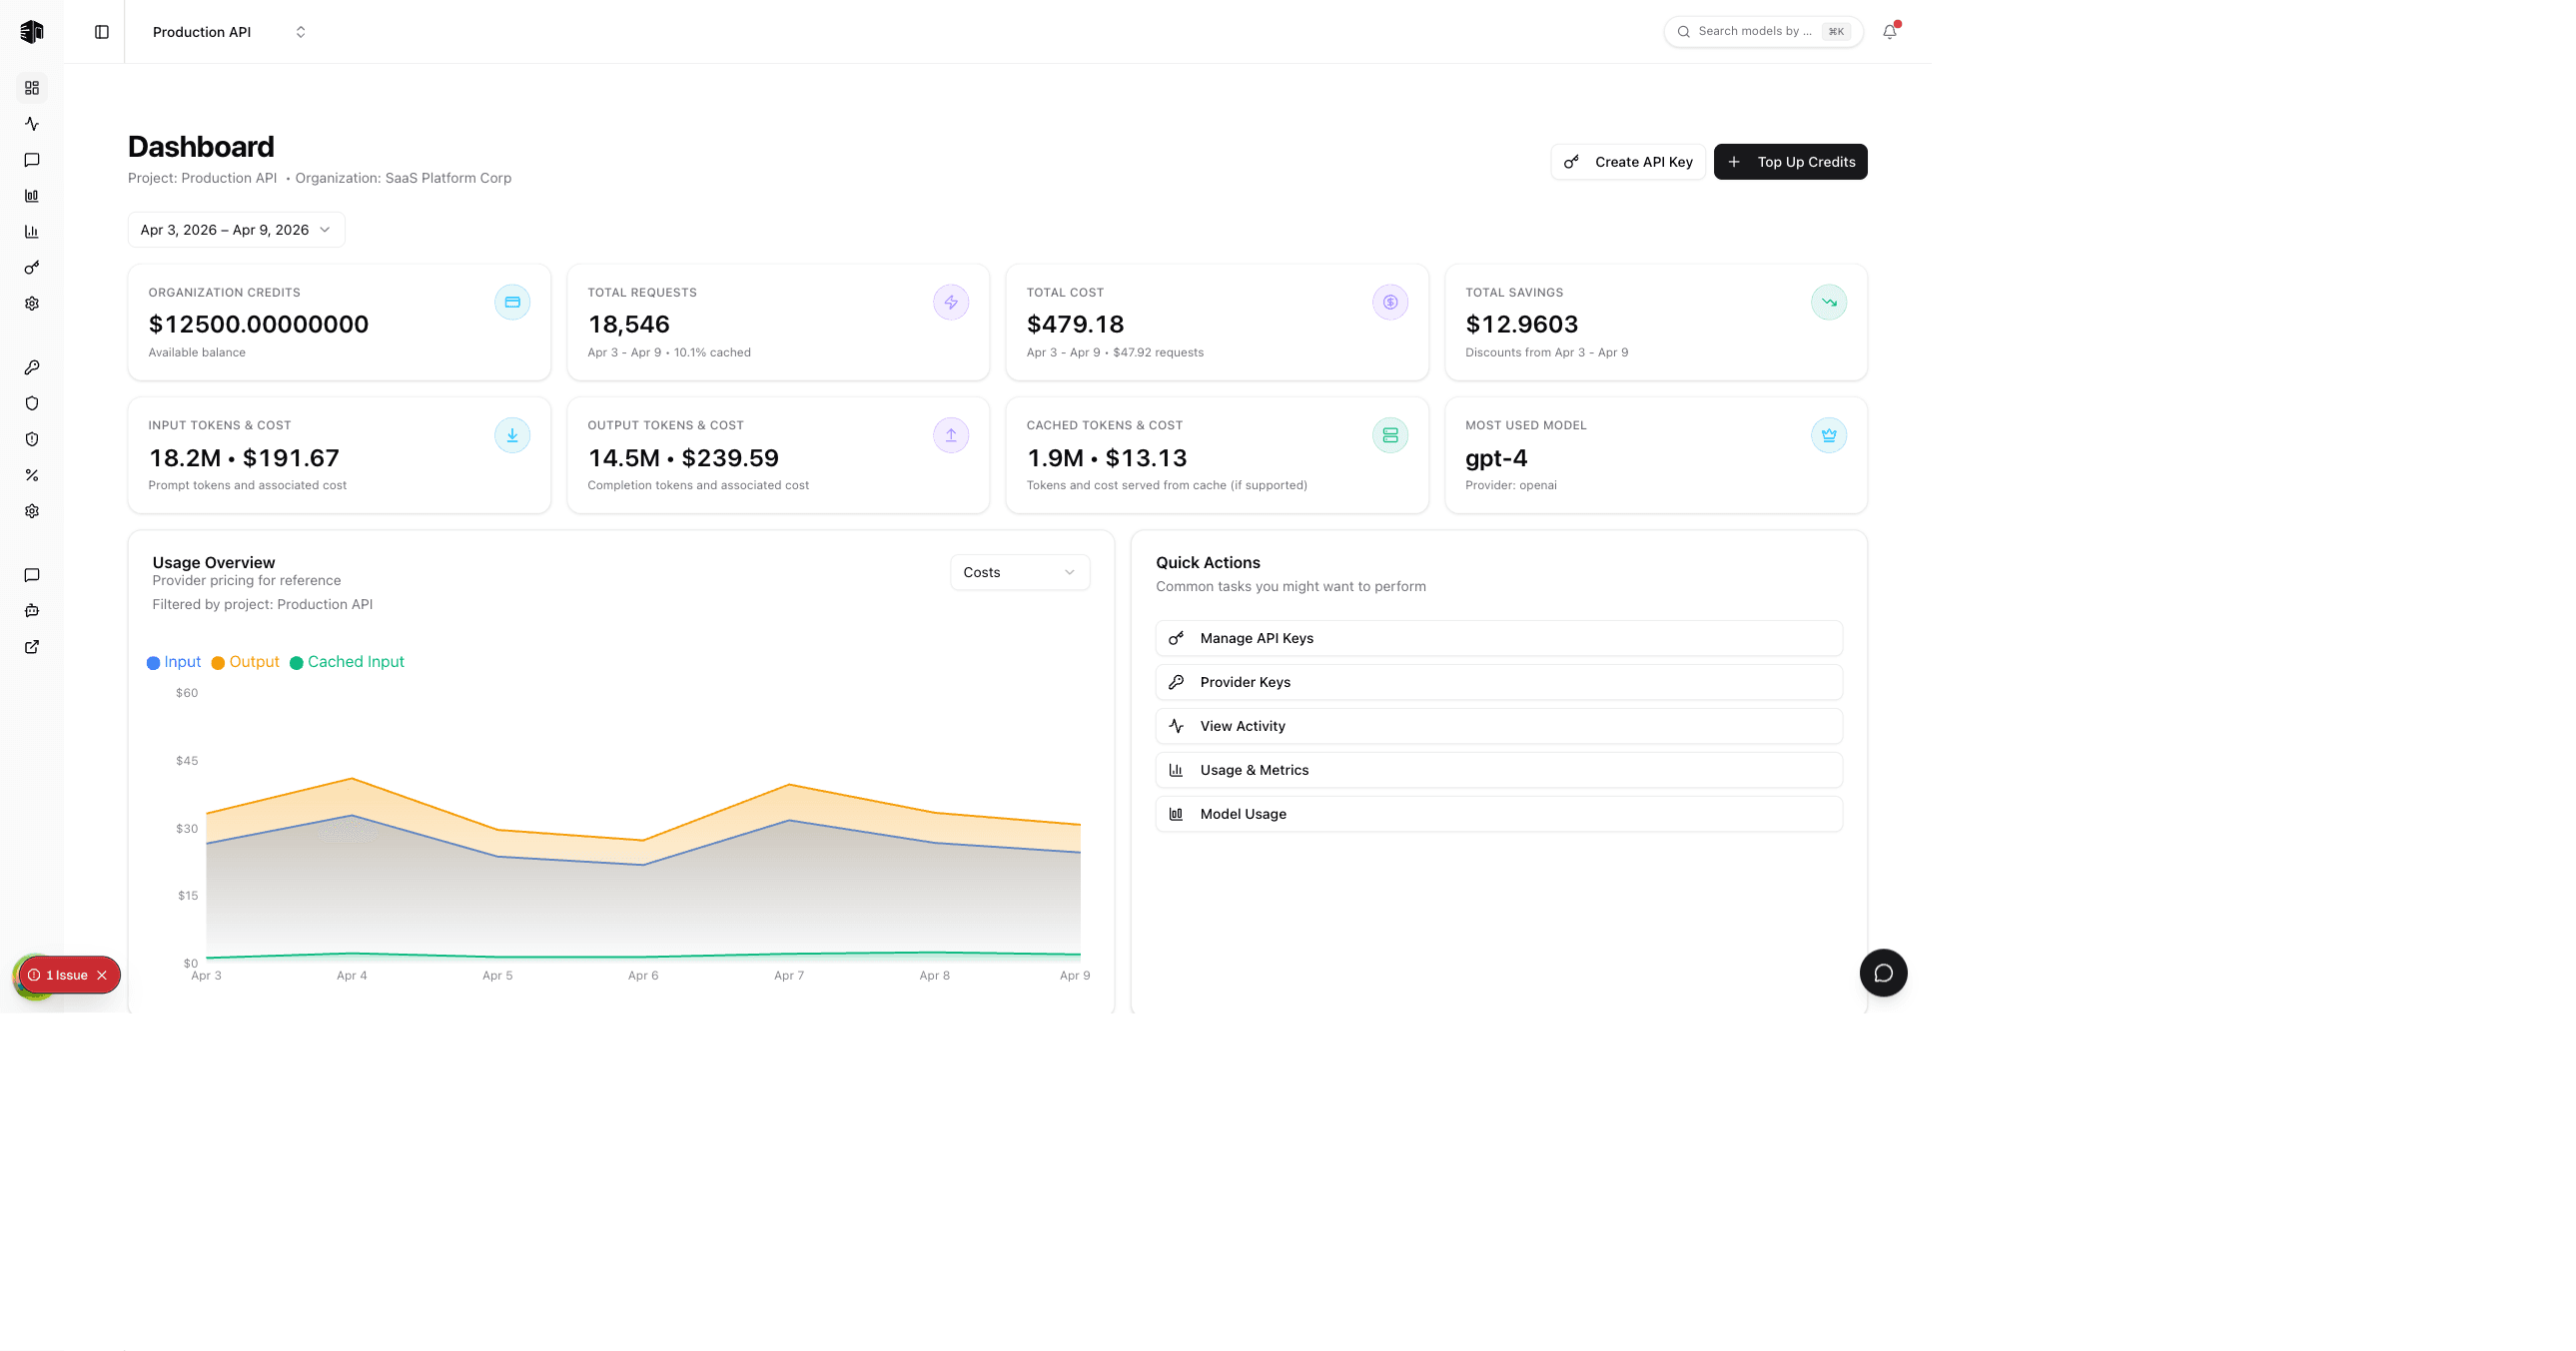
Your LLM operations at a glance
Real-time usage metrics, cost breakdowns, and performance monitoring across all your LLM operations.
Every request, inspectable
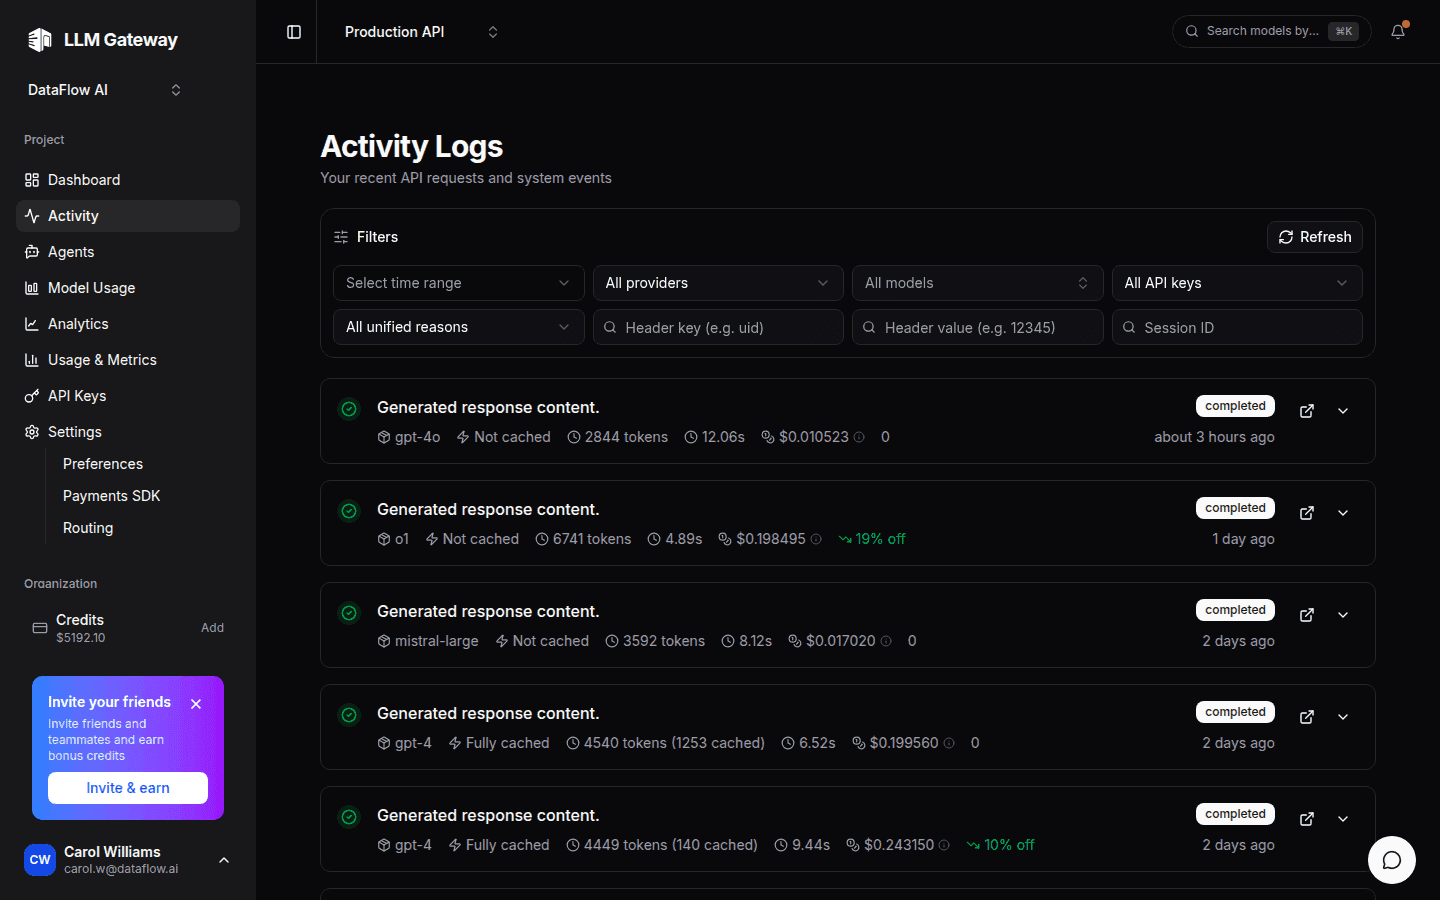
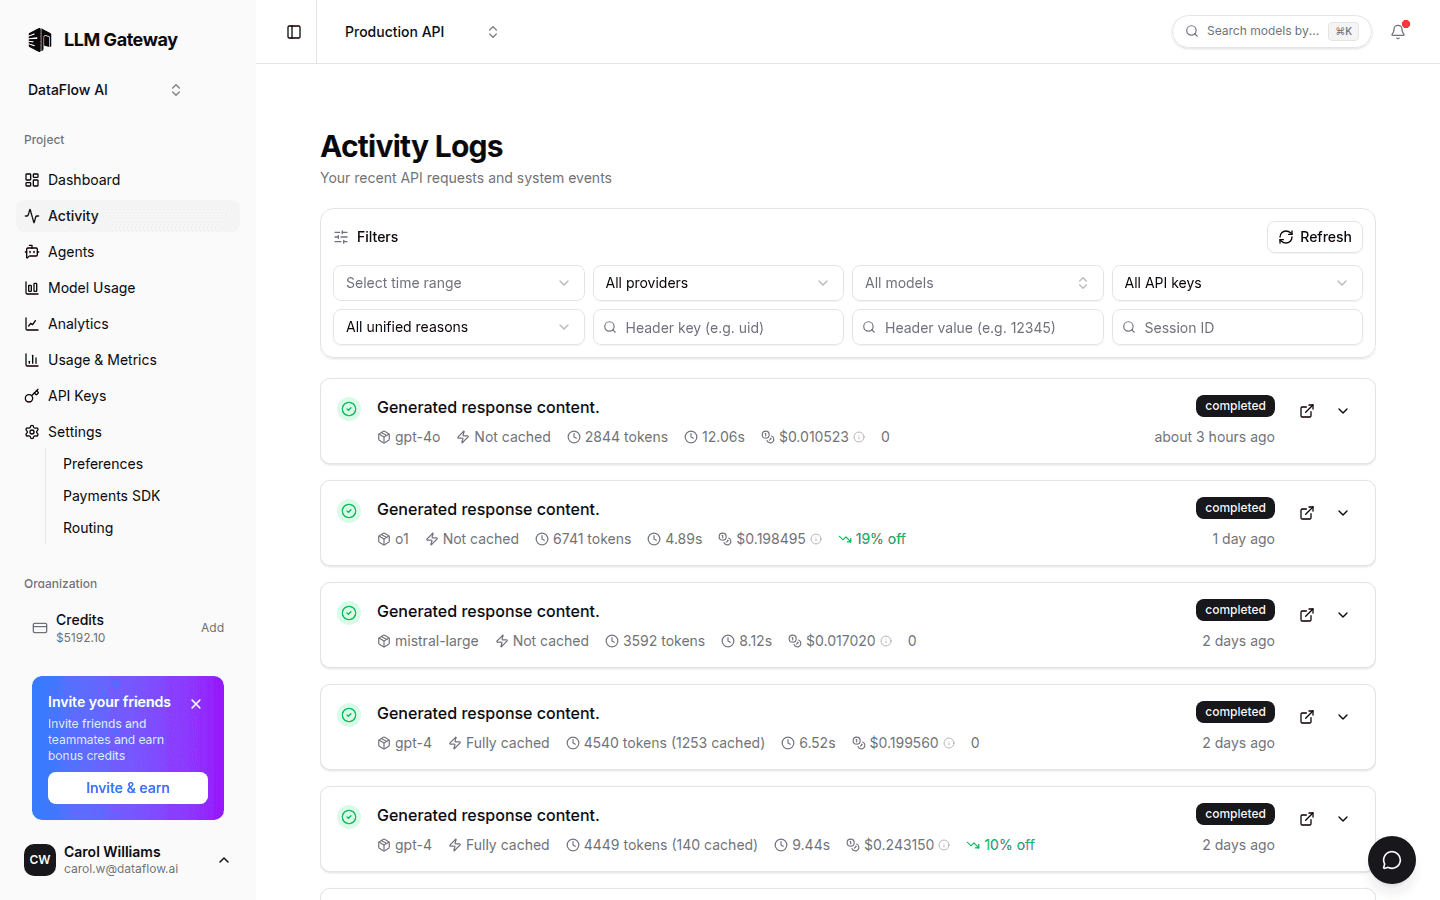
Filter request logs by model, provider, API key, finish reason, or session — then drill into any single request's metadata, or its full prompt and response on Enterprise.
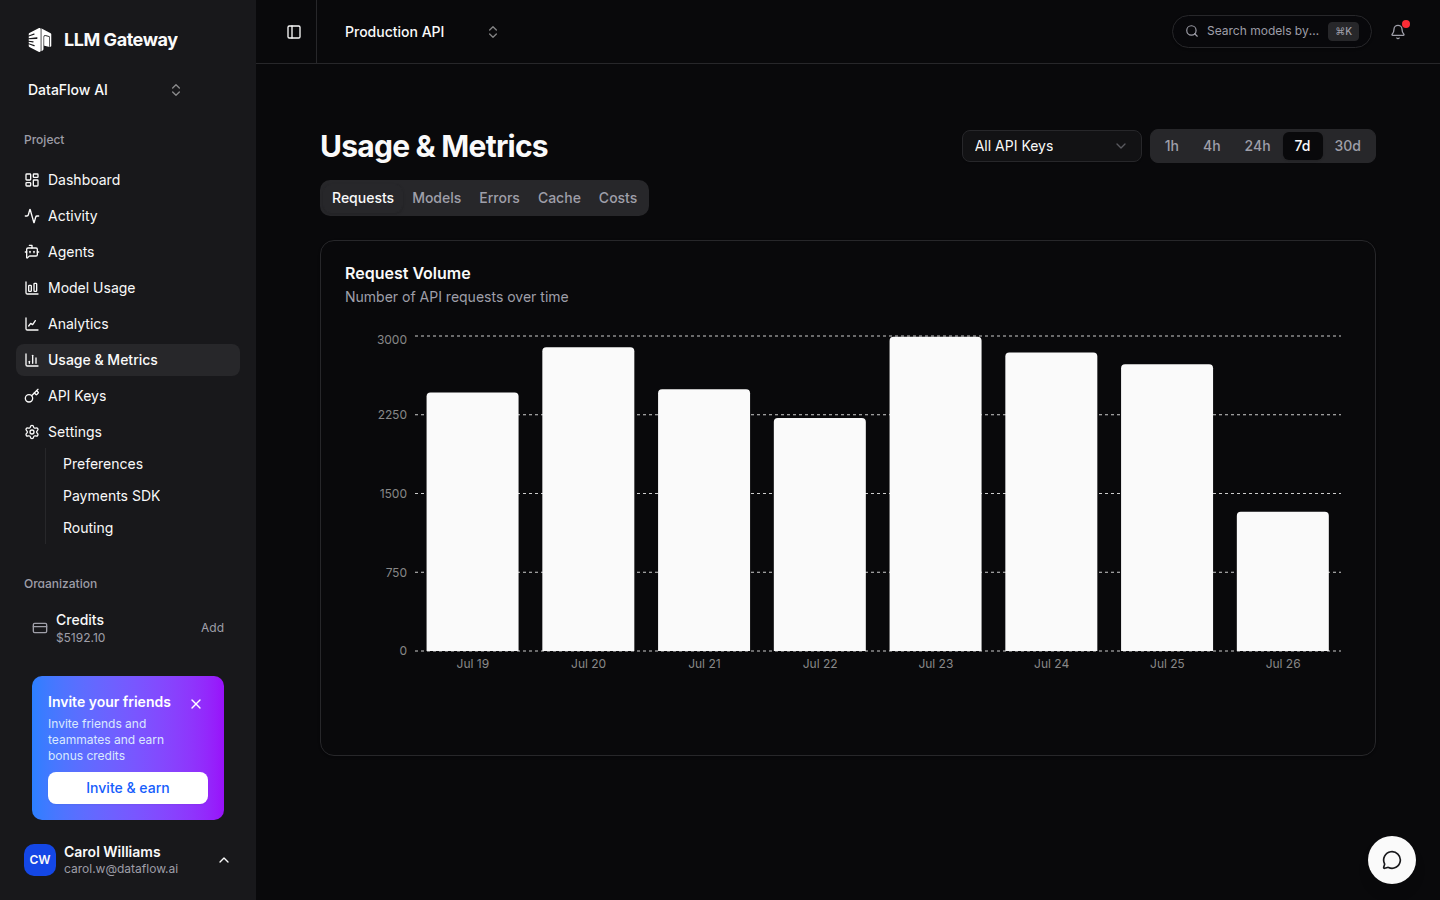
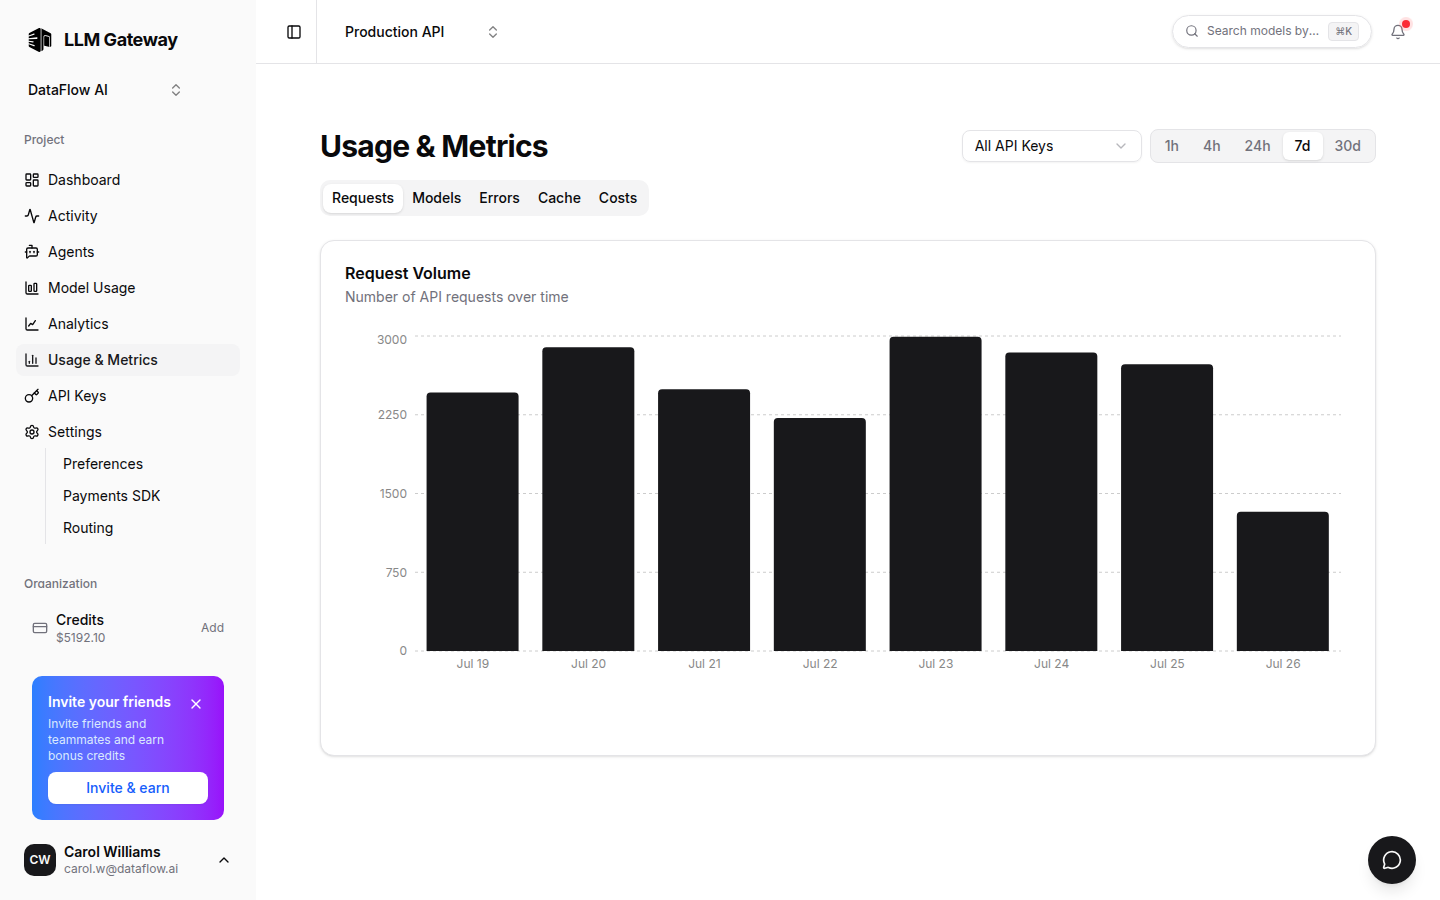
Usage & metrics
Requests, models, errors, caching, and costs — dedicated charts for each, per project or across your org.
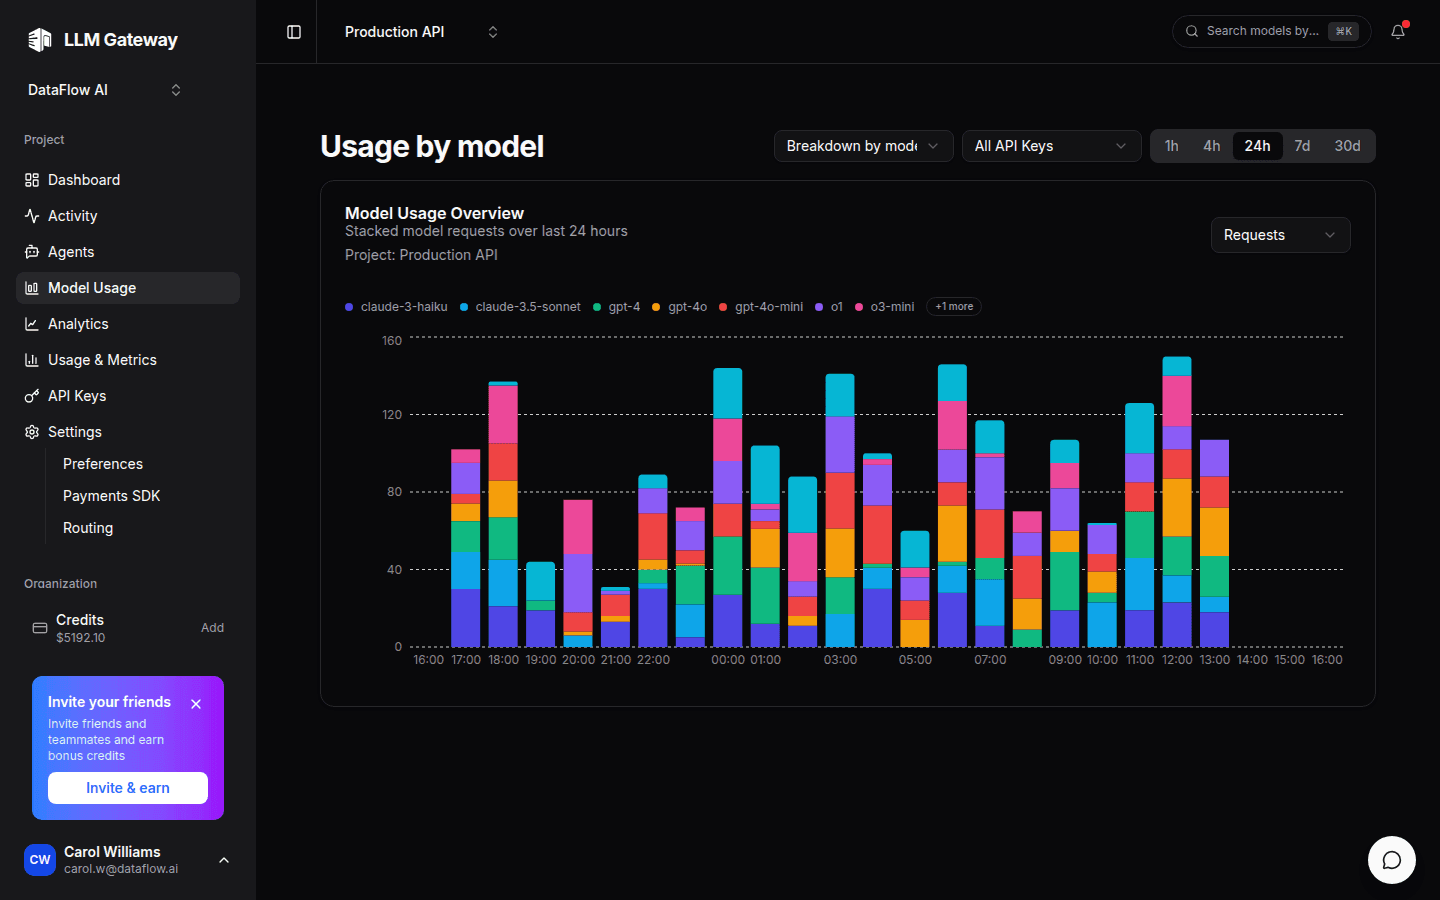
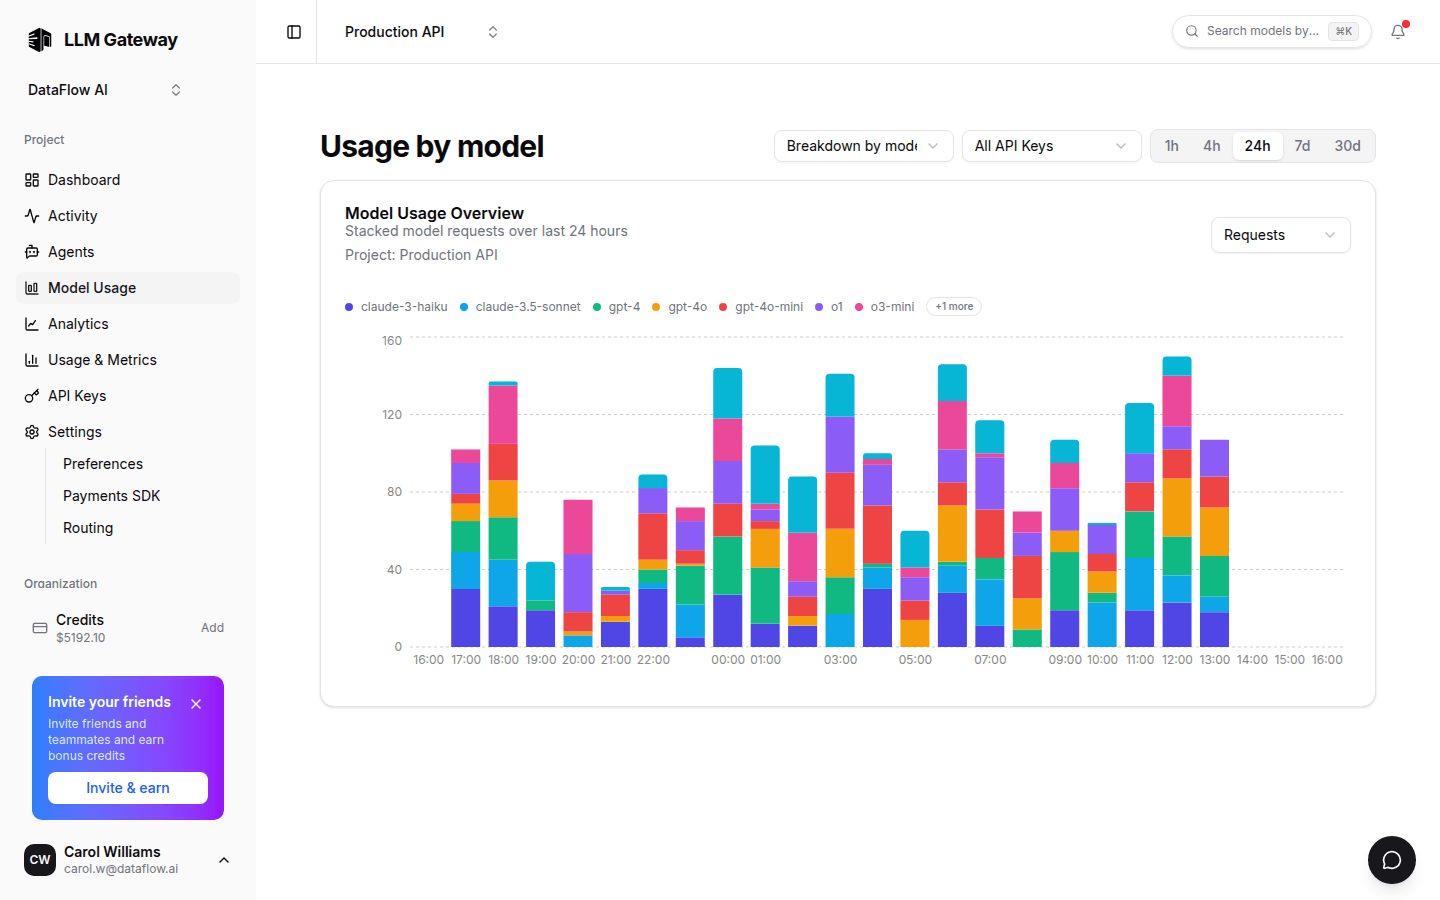
Spend by model, not just in total
Stack usage by model or provider over any window to spot the expensive outliers.
Observability that pays for itself
Request-level activity
Inspect every API request — model, tokens, cost, latency, finish reason, and the provider that served it. Full prompts and responses with Enterprise data retention.
Cost-aware analytics
See requests, tokens, total spend, and average cost per 1K tokens across 7 or 30 days — split by credits and provider keys.
Model & provider breakdown
Break down usage and spend by provider and model to spot expensive outliers quickly.
Errors & reliability
Monitor error rate, cache hit rate, and reliability trends directly from the dashboard — before your users notice.
Org & member analytics
Roll costs up across every project in your organization and break usage down per team member.
Audit logs
Track who did what, when — comprehensive audit trails for SOC 2 and HIPAA-ready compliance workflows.
Know what your AI actually costs
Every plan includes observability — start free with your own provider keys.